Gender Pay Gap Project
TABLE OF CONTENTS
Tools used
PosgreSQL | Excel | PowerPoint
Skills Used
SQL Querying | Data Wrangling | Data Visualization | Presentations
The Scenario
For this project I was given the scenario of working with a UK government department as a client concerned with monitoring the country’s gender pay gap in different industries. My task was to inspect 2022 government data on the subject to determine data limitations as well as what and where the pay gaps were across different metrics.
Querying the Data
The dataset used had 10,174 rows of self-reported gender pay gap data from gov.uk, and was accessed using PosgreSQL. I started by filtering for unique values in the table to see how many individual employers there were (10,174), and then I analyzed which features in the data table had too much missing data to consider further in the analysis. One of the greatest discrepancies here was whether or not 0 values in certain columns truly were null values or not. On the gov.uk website, employer calculations for pay bias towards women or towards men resulted positive or negative percentages with two decimal places. To me, this meant that columns related to such calculations would represent neutral or no bias as 0.0, so I considered this as a value and the integer value 0 as null.
Next, I started querying the dataset to get an understanding of the nation’s pay gap overall. I decided that the best way to comprehend any gaps as accurately as possible was to look at differences in mean hourly percentages so that I could see common salaries and not have my data skewed by outliers on either end of the pay spectrum. I used a CTE to remove null values in the table, and then calculated the average of the median bias percentage across all listed companies to find average 12.82% rate. This meant that on average, men in the UK were reported to earn 12.82% more than women across all companies.
Though this number was useful, it was too large a generalization to use individually and didn’t take into consideration the relative presence of men or women in particular industries (though in turn the argument could be made on the devaluation of wages and salaries in industries with higher female employee rates). The next step was to look at which companies in the country had the biggest pay gaps. I filtered the table for employer names, SIC codes (industry specifying codes), and median bias percentage, and ordered the table in descending order of this percentage. I limited the results to only 10 rows to look at the top 10 companies with the largest gaps, and found them to be mostly small construction companies with an overwhelming majority male employee base. I ran a similar query to this one, adding WHEN-THEN conditions to display whether or not pay differences were skewed to towards either side within pay quartiles. Aside from the almost exclusively male companies, there were some that had equal numbers of male and female employees in each quartile while still showing biases, implying discrepancies somewhere in median earnings.
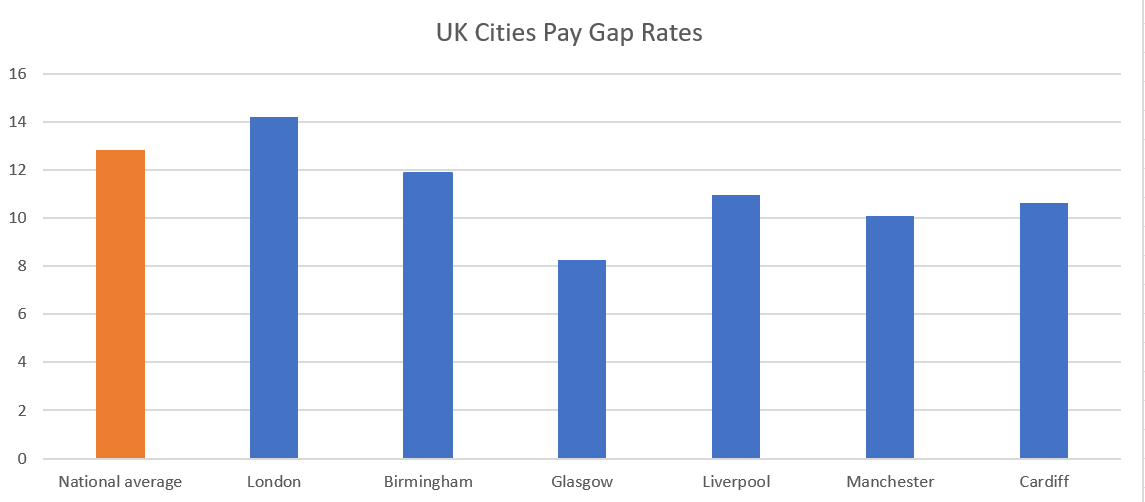
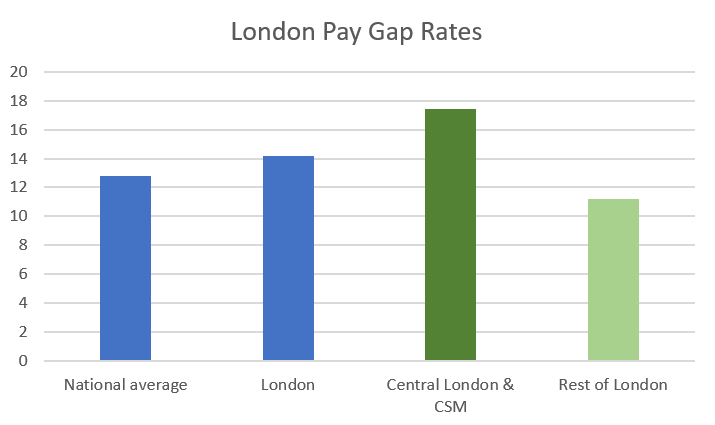
The next phase in my querying involved looking at bias rates across different geographical regions of the UK. I started by comparing the pay gaps in and out of London by taking a substring of the first two characters in each employer’s postcode. I checked if the substring matched a list of values corresponding to the different postcodes in London (E1, WC, N9, SW, etc.) and found the average pay-gap in and out of London to be 14.20%. and 12.45% respectively. I added an extra query that looked at London in and out of its financial center (City Square Mile) and found a much higher gap rate of 17.42%. I ran similar queries for different cities around the country like Birmingham and Manchester by matching the postcode substrings to the respective city’s first two postcode characters, and found these values to be more similar to the out-of-London averages.
Lastly, I looked at how these gaps might differ by industry. I was most curious about the financial sector and education, as these industries are heavily dominated by men and women respectively. Once I knew their corresponding SIC codes, I filtered the table for employers with these codes and took their average bias percentage as well as a the relative biases within each pay quartile. Both industries had incredibly high pay gaps, with 24.98% for education and 30.82% for finance.
Visualizing the Data
After looking at the gender pay-gap data from these different angles, I exported some of my queried tables to CSV files to visualize and understand their findings better. I chose to focus on the geographical differences in pay as well as banking and education industry differences, as I found these to be the most striking. Using Excel, I started by looking at the pay gap rates in major UK cities using a bar chart. I pulled values for London, Birmingham, Glasgow, Liverpool, Manchester, and Cardiff, as I felt it important to not only look in England but in other countries within Britain in case they showed different variations. Further investigations would have done well to compare Wales and Scotland within themselves to see differences between urban and non-urban employers, but this was beyond the scope for the project. For easy comparison, I highlighted the national average pay gap in a contrasting color so that it would be easier to see how much these cities differed from it, and overall I found pretty similar rates across several of these cities.
To look at pay gaps within London, I displayed the whole city against the national average and added columns comparing City Square Mile with the rest of the city to find that the financial district was significantly higher than the rest of London. This difference likely is driving the city’s pay gap rate above the national average, because the rest of the city is much more similar to how other cities in the UK perform.
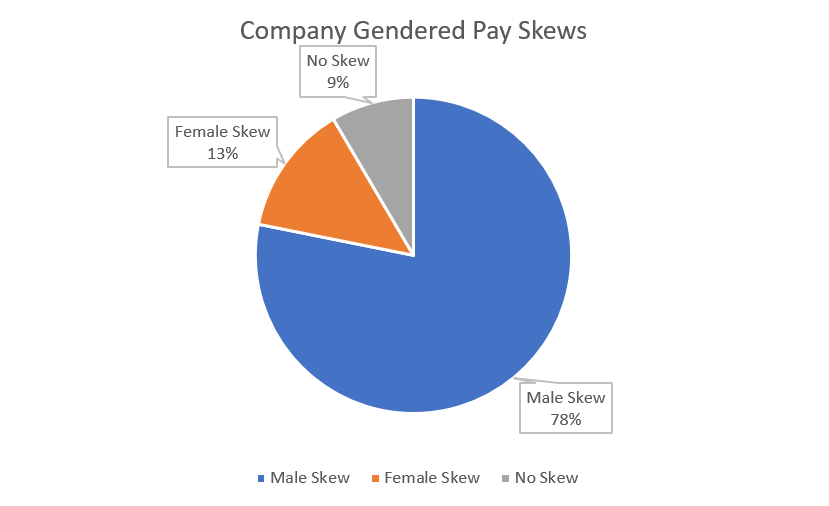
I thought it would be interesting to see an overarching look at how payment skews between male and female employees across the dataset as well, and I quickly pulled a table counting the number of employers with their payment biases skewed towards which gender. I used this data to compare the skews with a pie chart and found 78% of the employers had a male skew, compared with 13% female skew and only 9% without any skew at all.
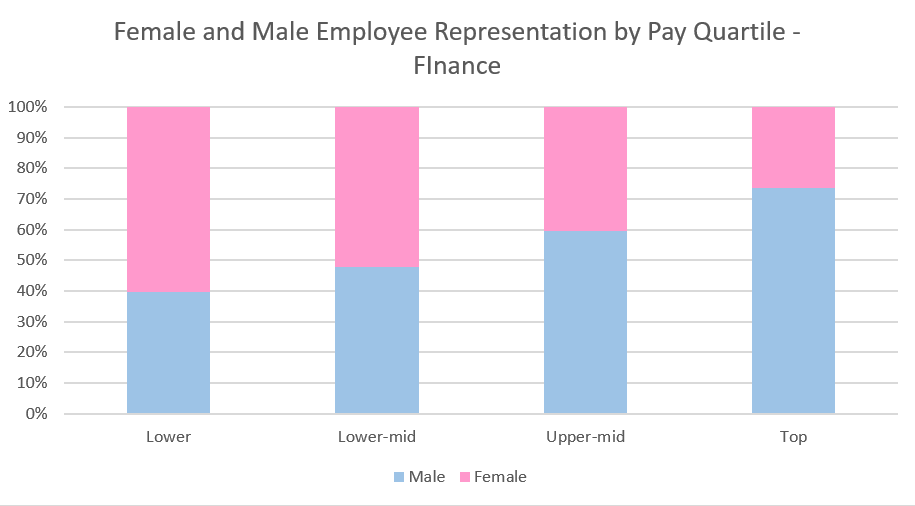
To best display pay discrepancies by industry. As I had already found the 30.82% pay gap, I was interested in seeing how the presence of men or women in different pay quartiles might influence this number. I pulled the male and female employee percentages by pay quartile and displayed lower, lower-mid, upper-mid, and top pay quartiles as stacked bar charts. I colored the male and female employees in contrasting colors to better see these values, and found that male employees were increasingly represented between the lower and top pay ranges. In the lower quartile, women account for about 60% of the employees and men 40%. With each successive quartile, the representation of male employees goes up by over 10% and drops by the same rate for female employees. This is likely why there is such a large pay gap.
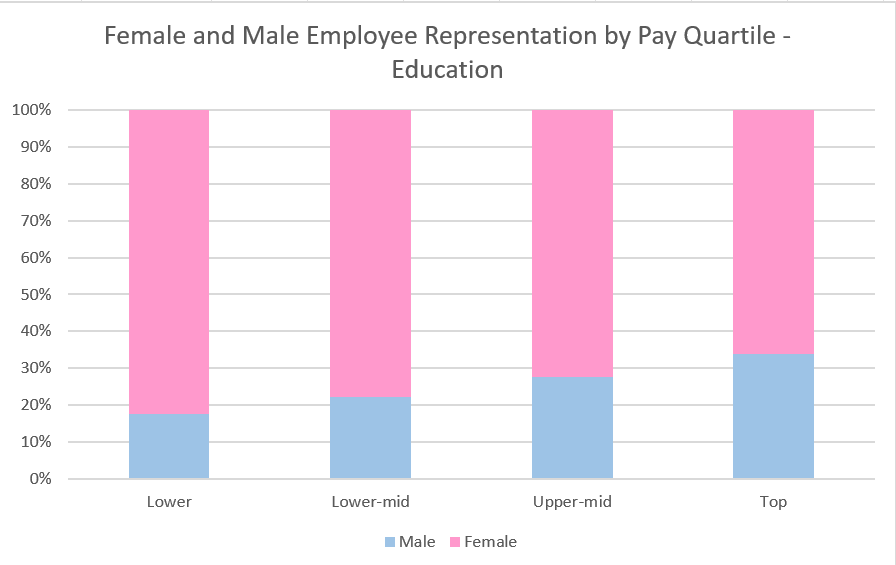
I replicated this same graph for the education industry to see why its pay gap of 24.98% is so high despite being a field known for high female employment. In all four quartiles, women made up the overwhelming majority of employees, with 81% in the lower quartile and 65% in the top. The high pay gap rate despite lower male presence in the industry imply that factors other than representation are at play when it comes to payment.
Final Reflections
It would be interesting to get more data on the individual quartiles within an industry to see where this discrepancy lies. With the example of the education industries, It could be that where there are male employees there’s more money being paid to them and it skews the data even when they represent only a third of a quartile. It could also be that these numbers are offset by data contributions from part-time, contract, and on-leave employees (higher numbers of female employees would lend itself to higher numbers of employees on maternity leave, for example).
